The monsoon arrives
Watch the southwest monsoon sweep across India, day by day, in five different years.
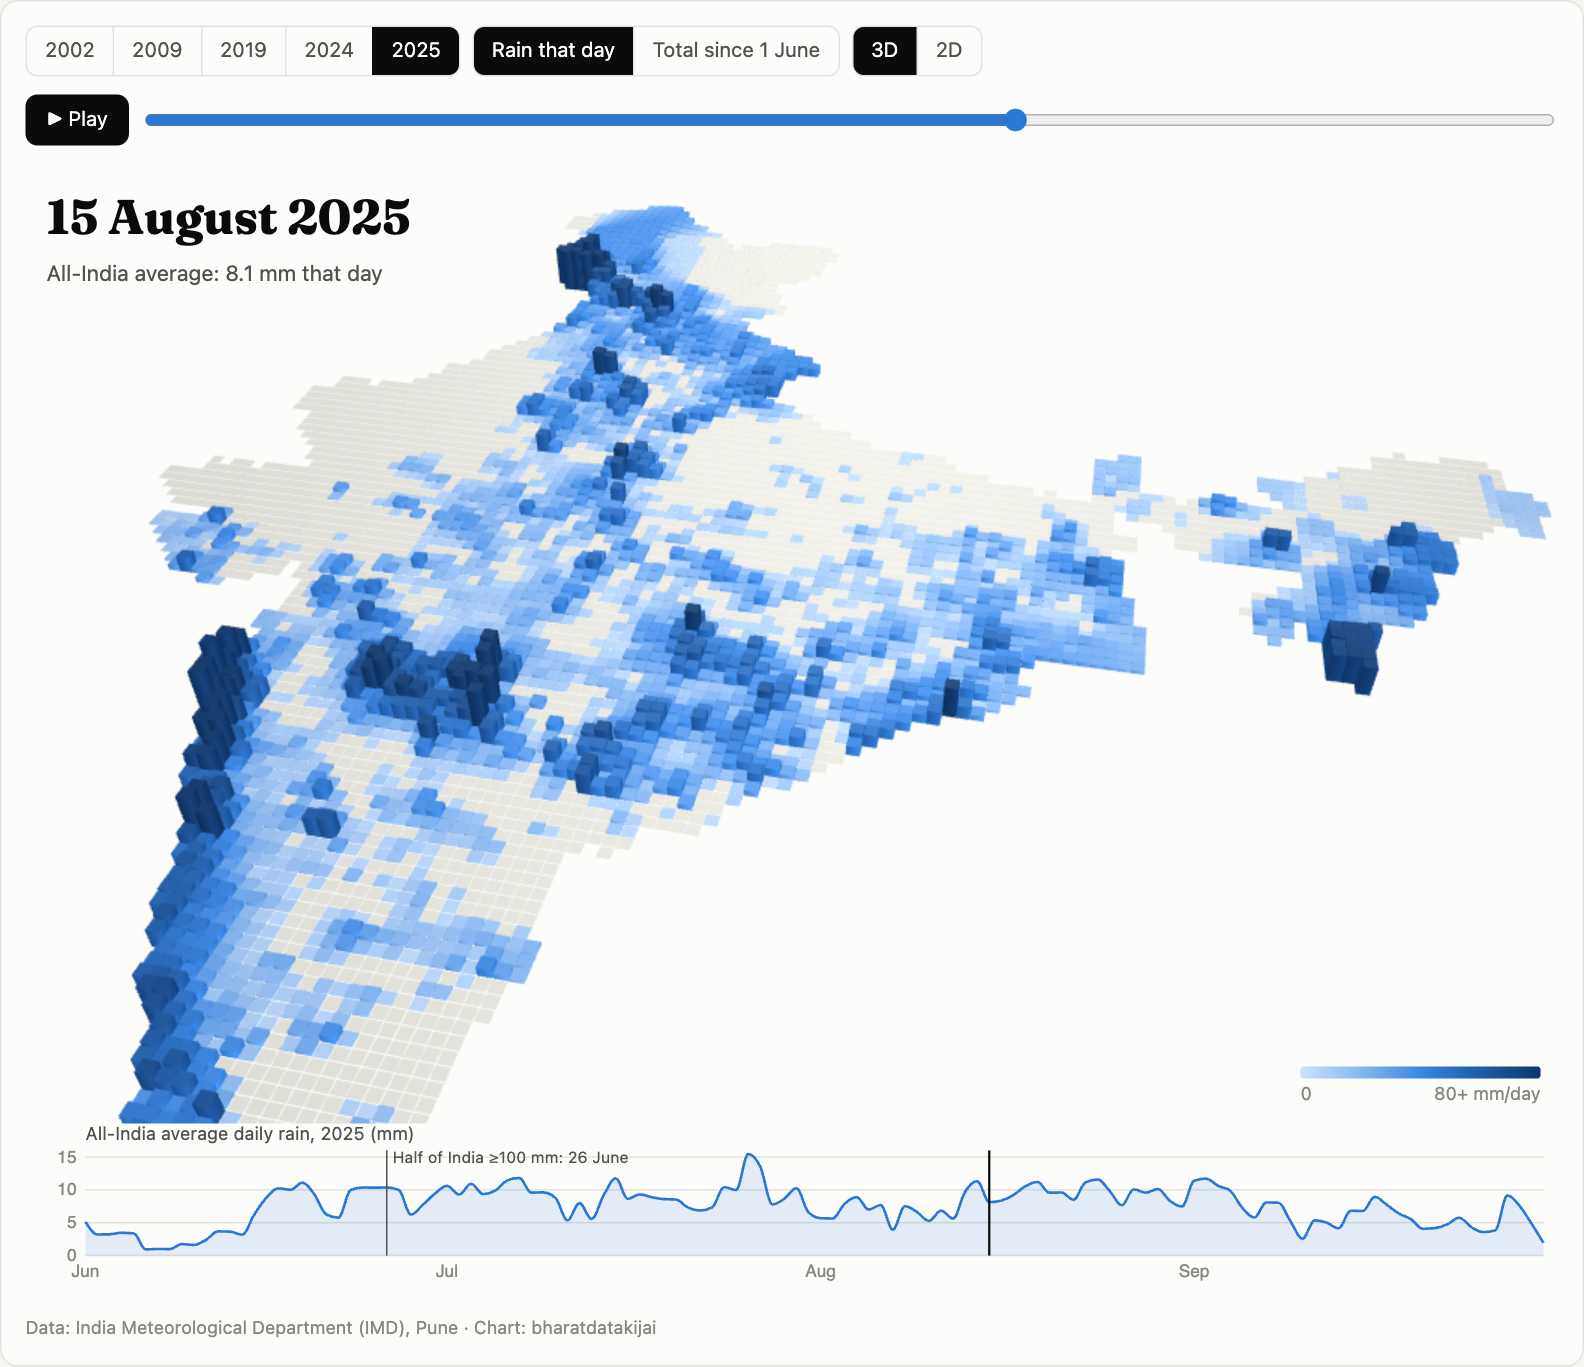
Each column is a 25 km square of India. Its height and color show how much rain fell there that day, from IMD’s gridded record of thousands of rain gauges. Press play and the southwest monsoon arrives on the Kerala coast, runs up the Western Ghats, floods the northeast and slowly spreads across the Gangetic plain toward Rajasthan.
Switch to Total since 1 June to watch the season fill the country in. Then compare years. In 2025, half of India’s grid cells had seen at least 100 mm of rain by 26 June. In the drought year 2009, that didn’t happen until 9 July, and the season ended about a quarter drier than 2019 (725 mm against 961 mm, averaged over grid cells).
Drag to rotate the map, and hover over any square for its numbers. The chart below the map tracks the all-India daily average.