India, in charts.
Interactive data visualizations of India: climate, population, elections, digital payments, energy and more. Every chart is built from official Government of India data, with a link to the source and the data for download.
-
 AI-generated
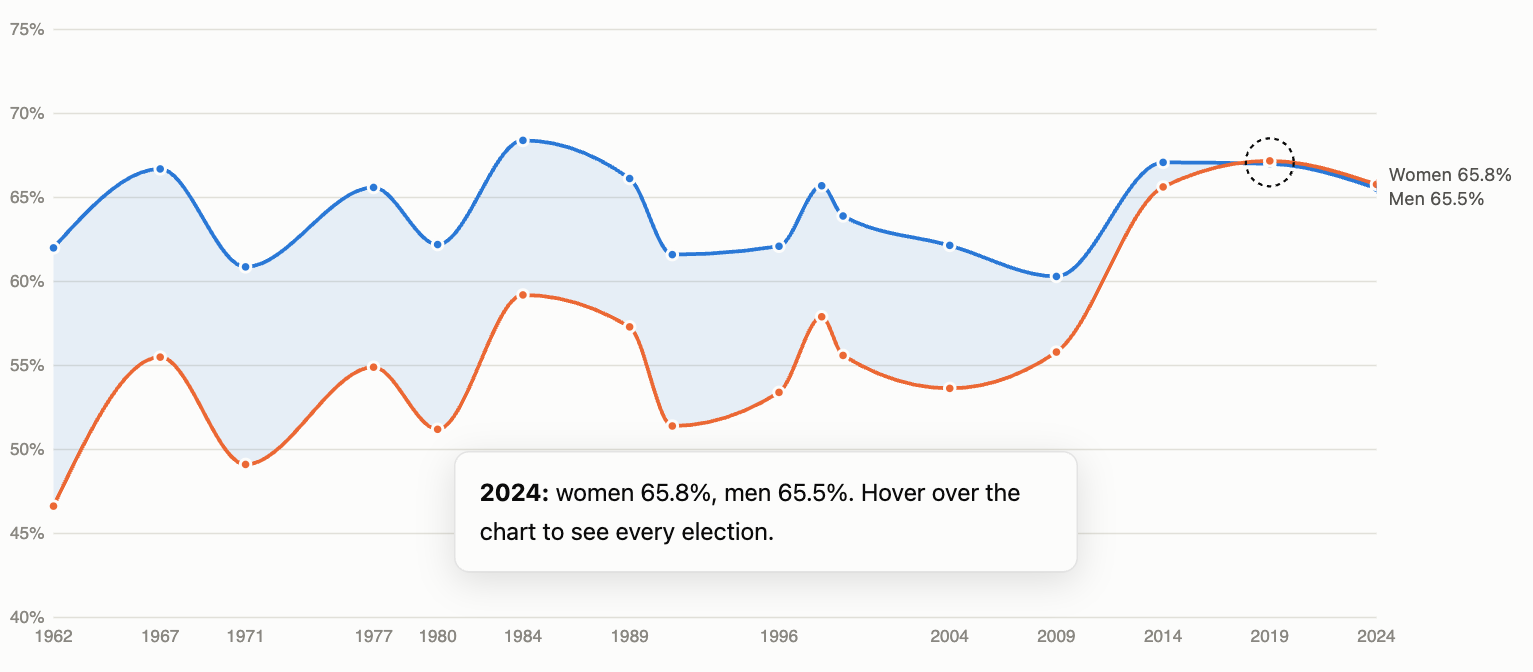
Women now vote more than men
AI-generated chart. In 1962 the turnout gap between men and women was 15 points. In 2019, for the first time, women's turnout was higher.
-
 AI-generated
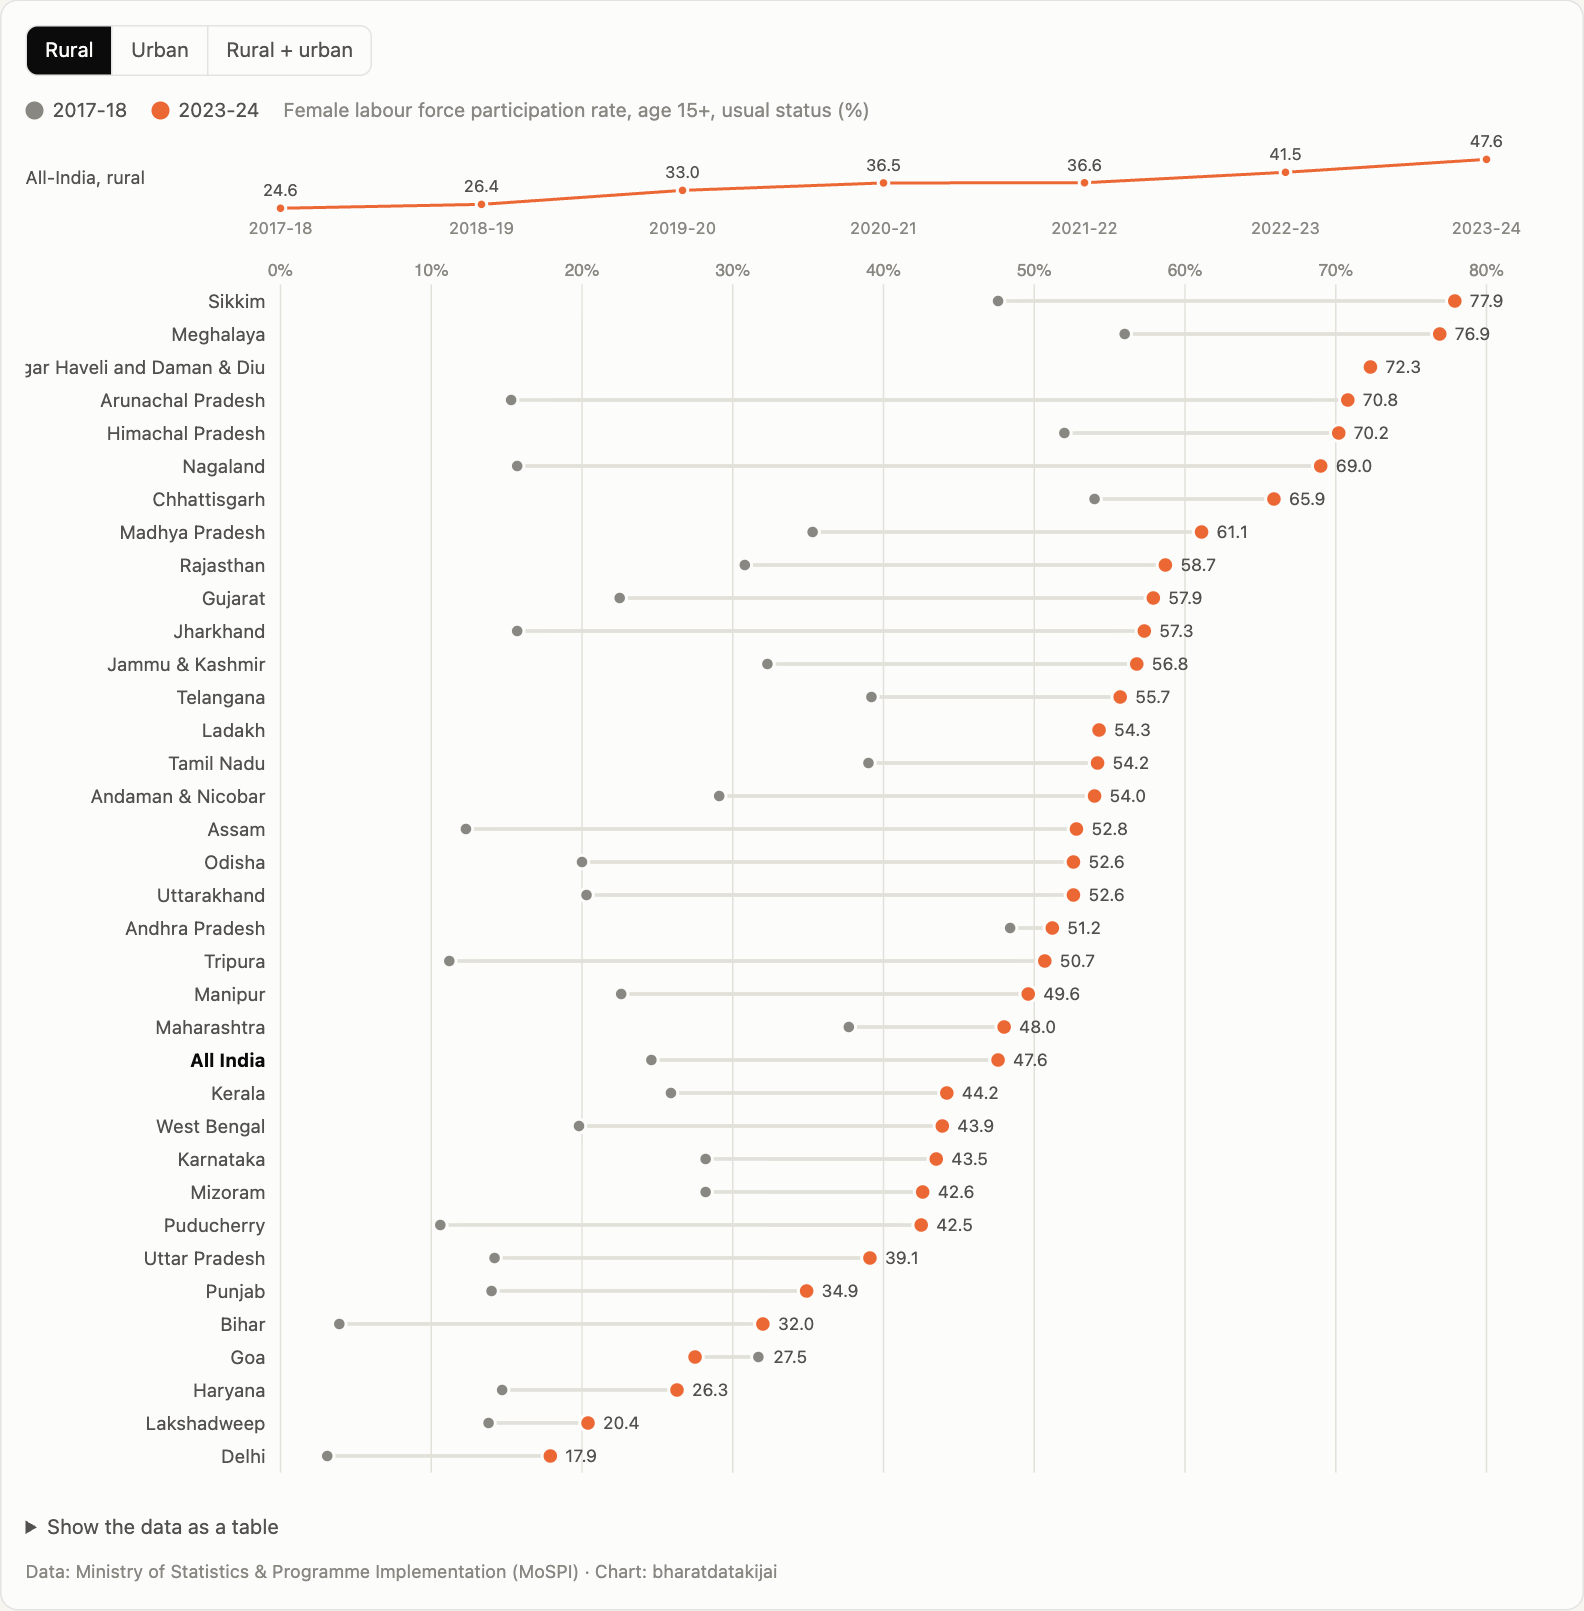
Women joining the workforce, 2017–2024
AI-generated chart. The share of Indian women in the labour force went from 23% to 42% in six years. In rural India it nearly doubled.
-
 AI-generated
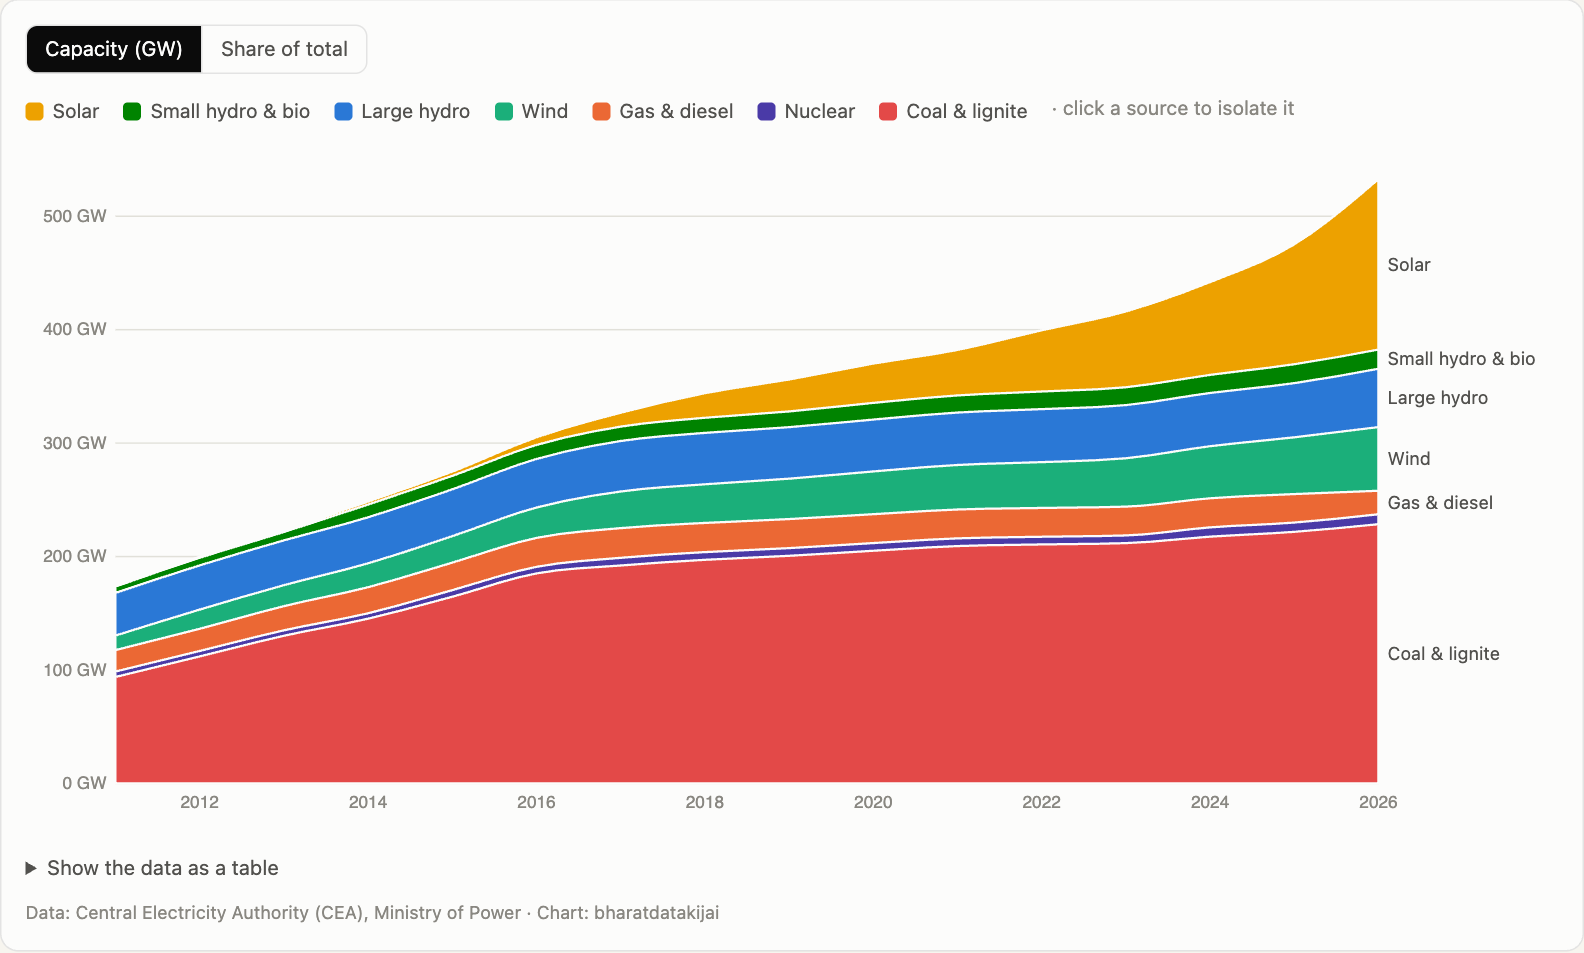
How India makes its electricity
AI-generated chart. Solar capacity went from 32 MW to 150,000 MW in fifteen years. Renewables are now 42% of what India can generate.
-
 AI-generated
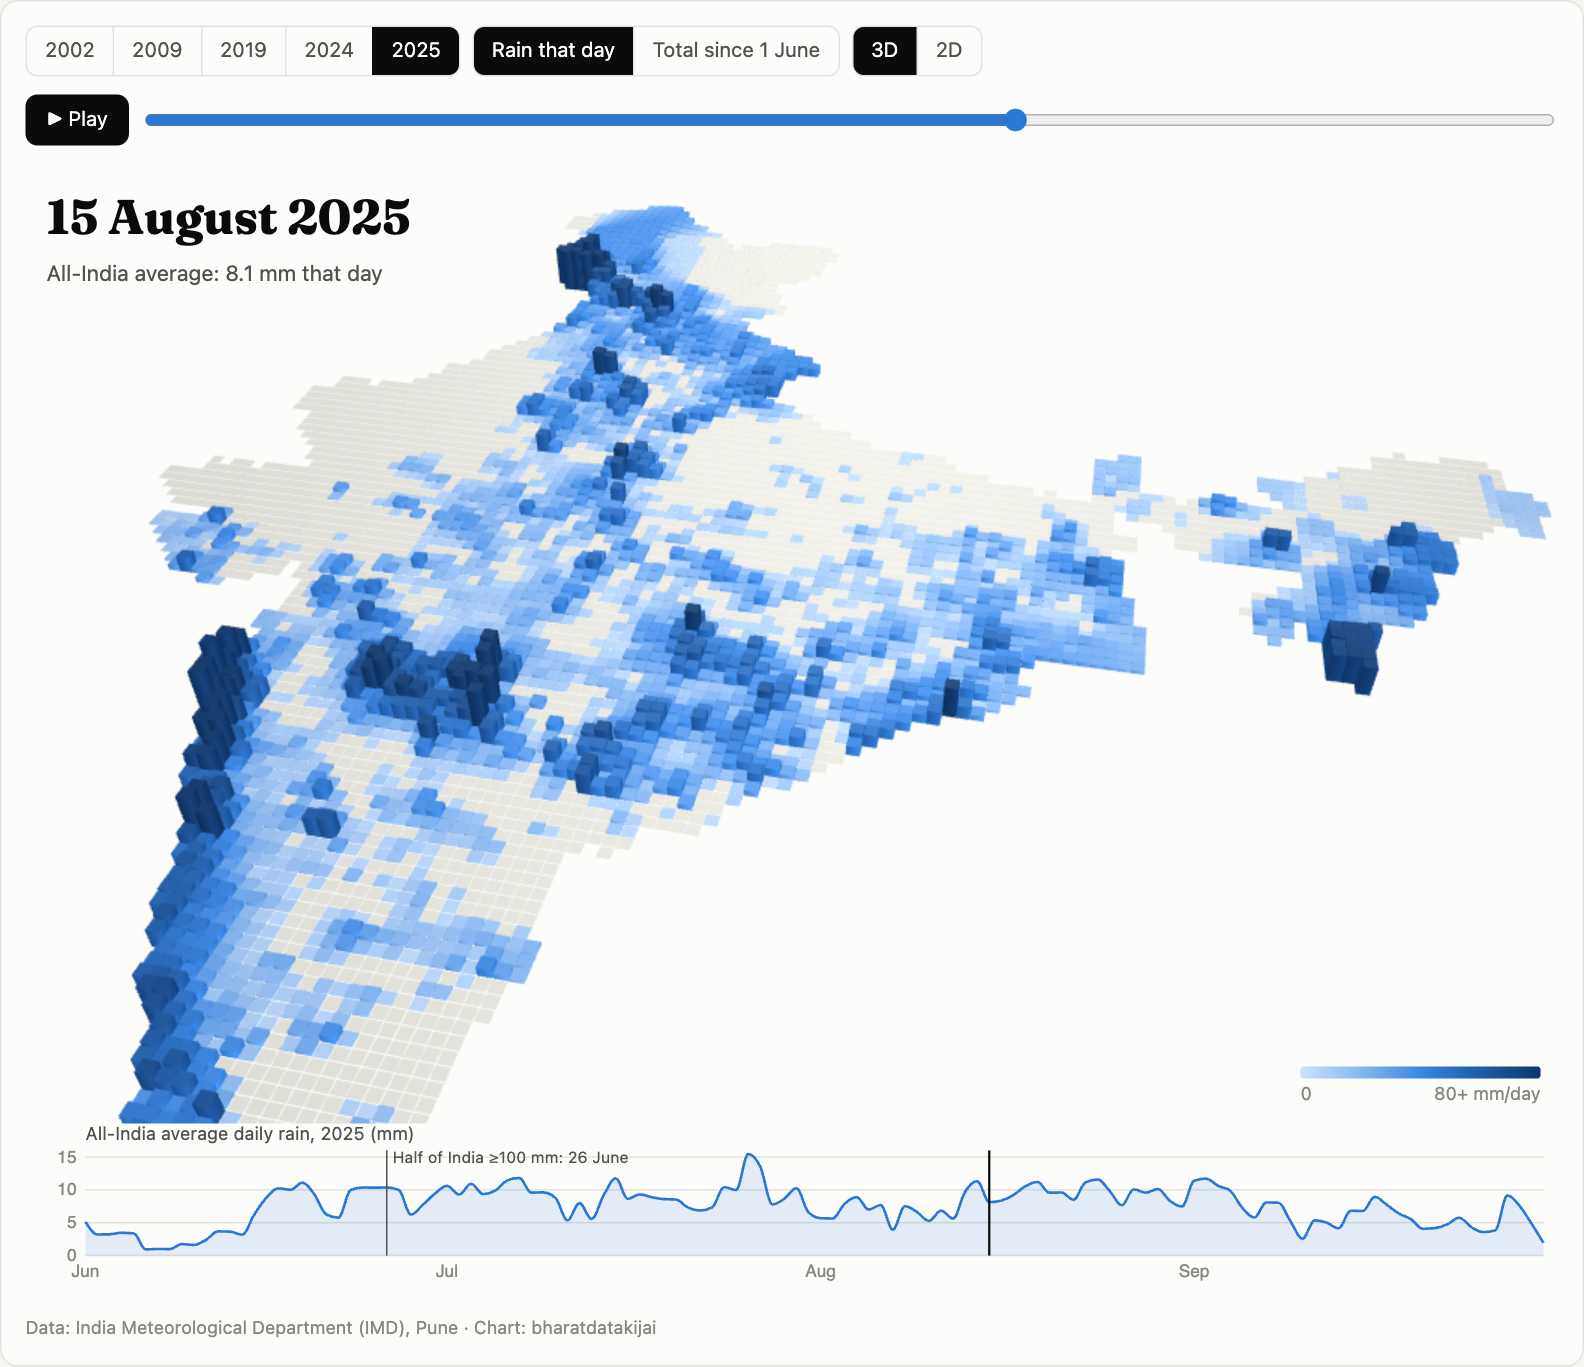
The monsoon arrives
AI-generated chart. Watch the southwest monsoon sweep across India, day by day, in five different years.
-
 AI-generated
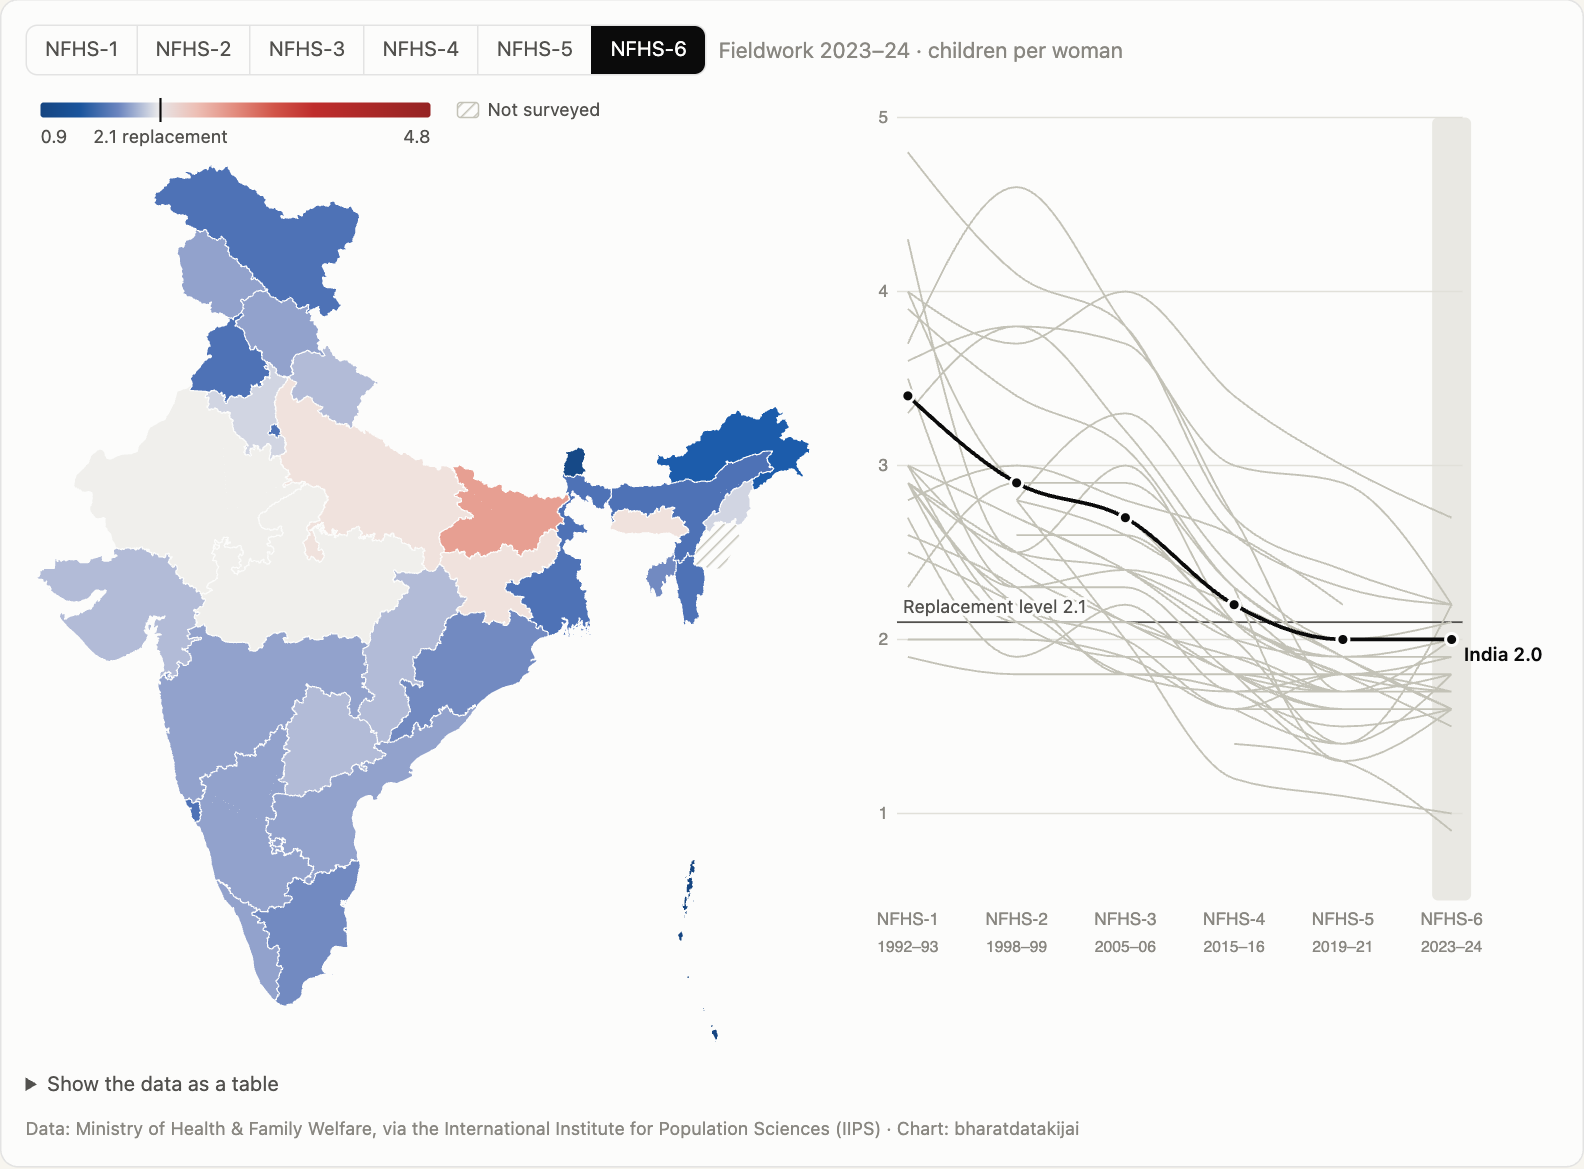
Every state's fertility rate, 1992–2024
AI-generated chart. In three decades India went from 3.4 children per woman to 2.0. Only a handful of states are still above replacement level.
-
 AI-generated
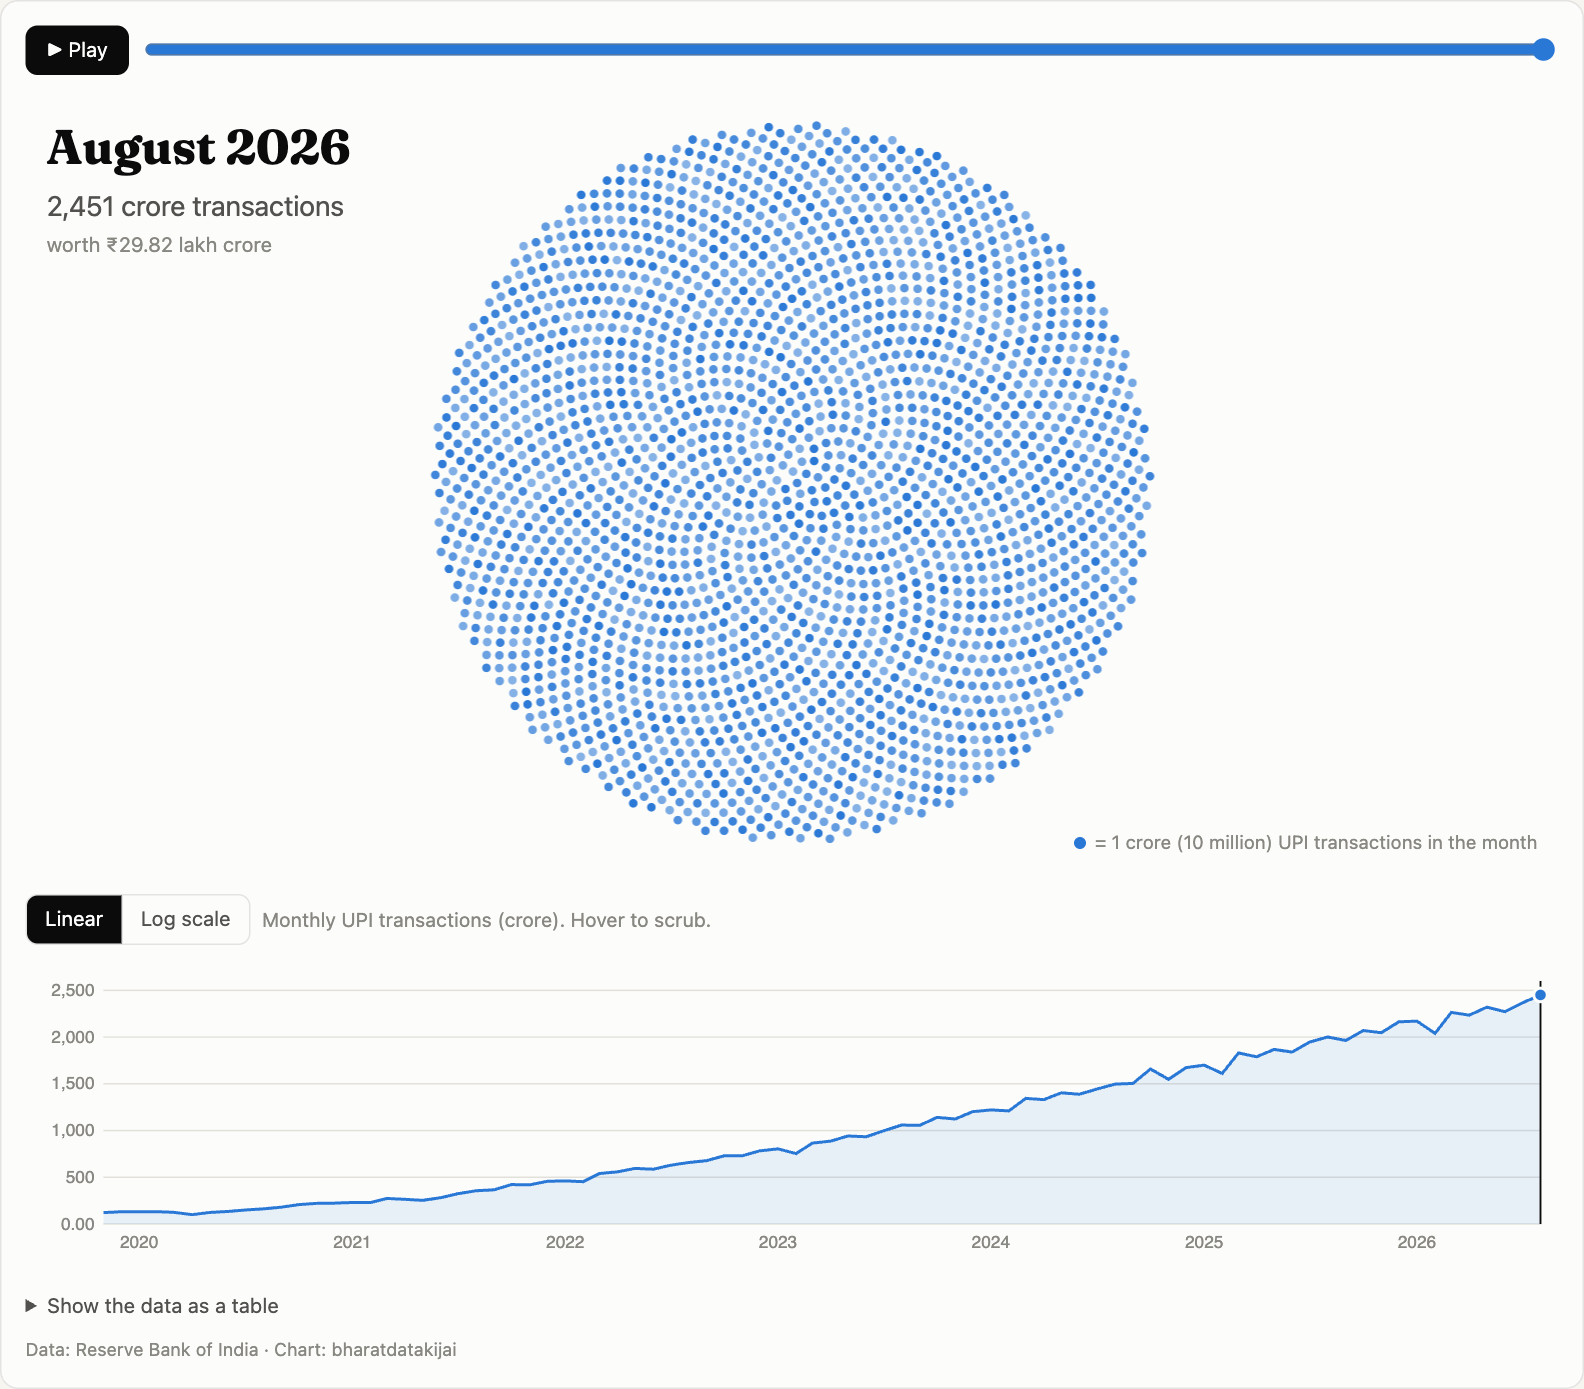
The UPI explosion
AI-generated chart. In November 2019 Indians made 122 crore UPI payments. In August 2026 they made 2,451 crore, twenty times as many.
-
 AI-generated
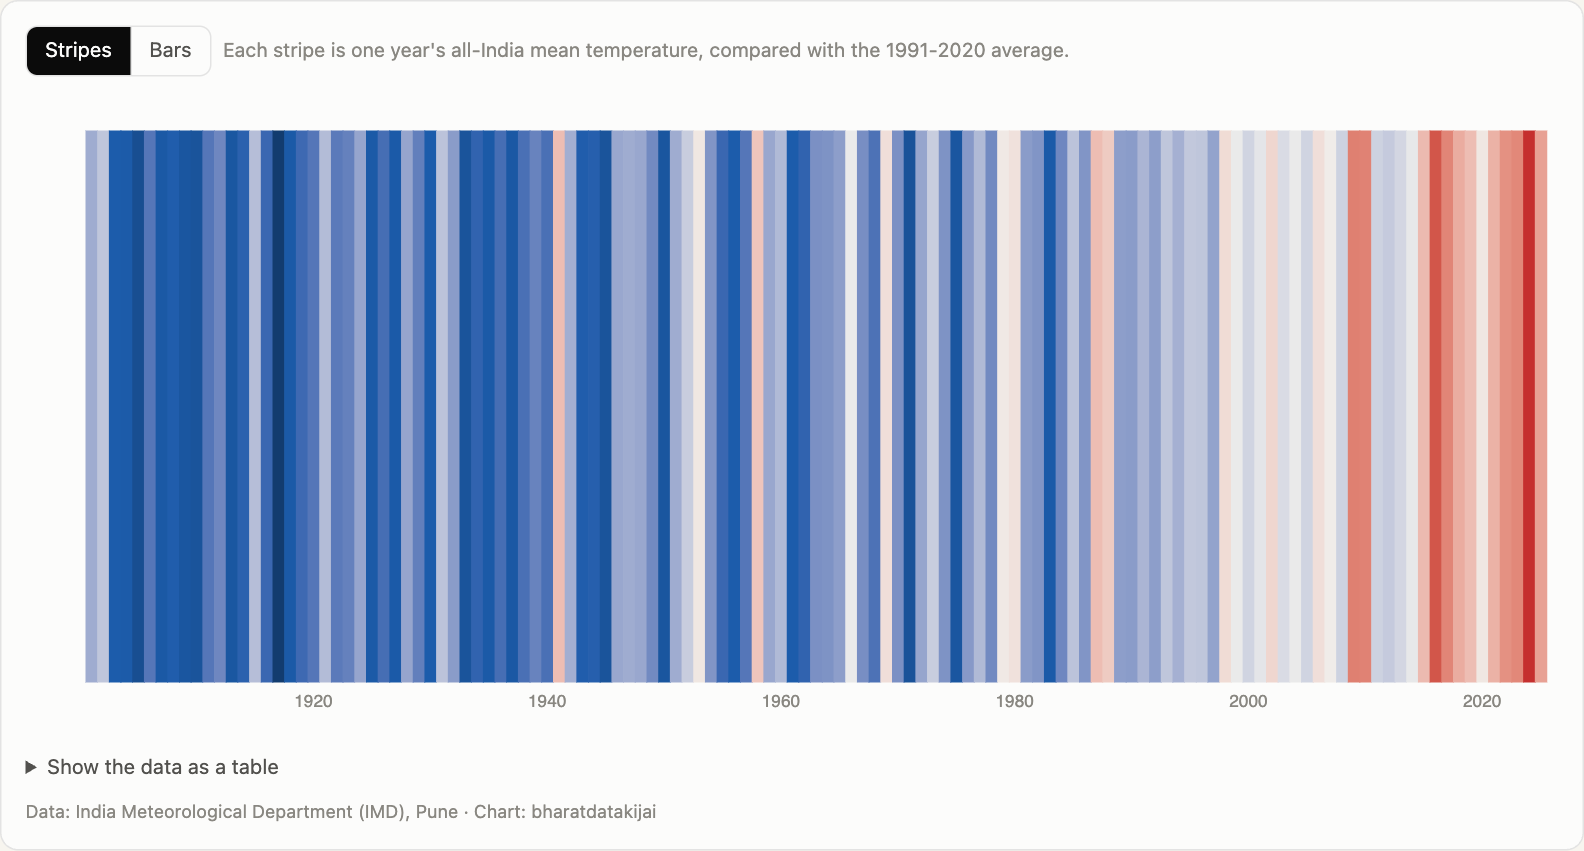
India's warming stripes, 1901–2025
AI-generated chart. 125 years of Indian temperatures in one chart. The recent years are the reddest.