29 September 2026 · India Meteorological Department (IMD), Pune · AI-generated
India's warming stripes, 1901–2025
125 years of Indian temperatures in one chart. The recent years are the reddest.
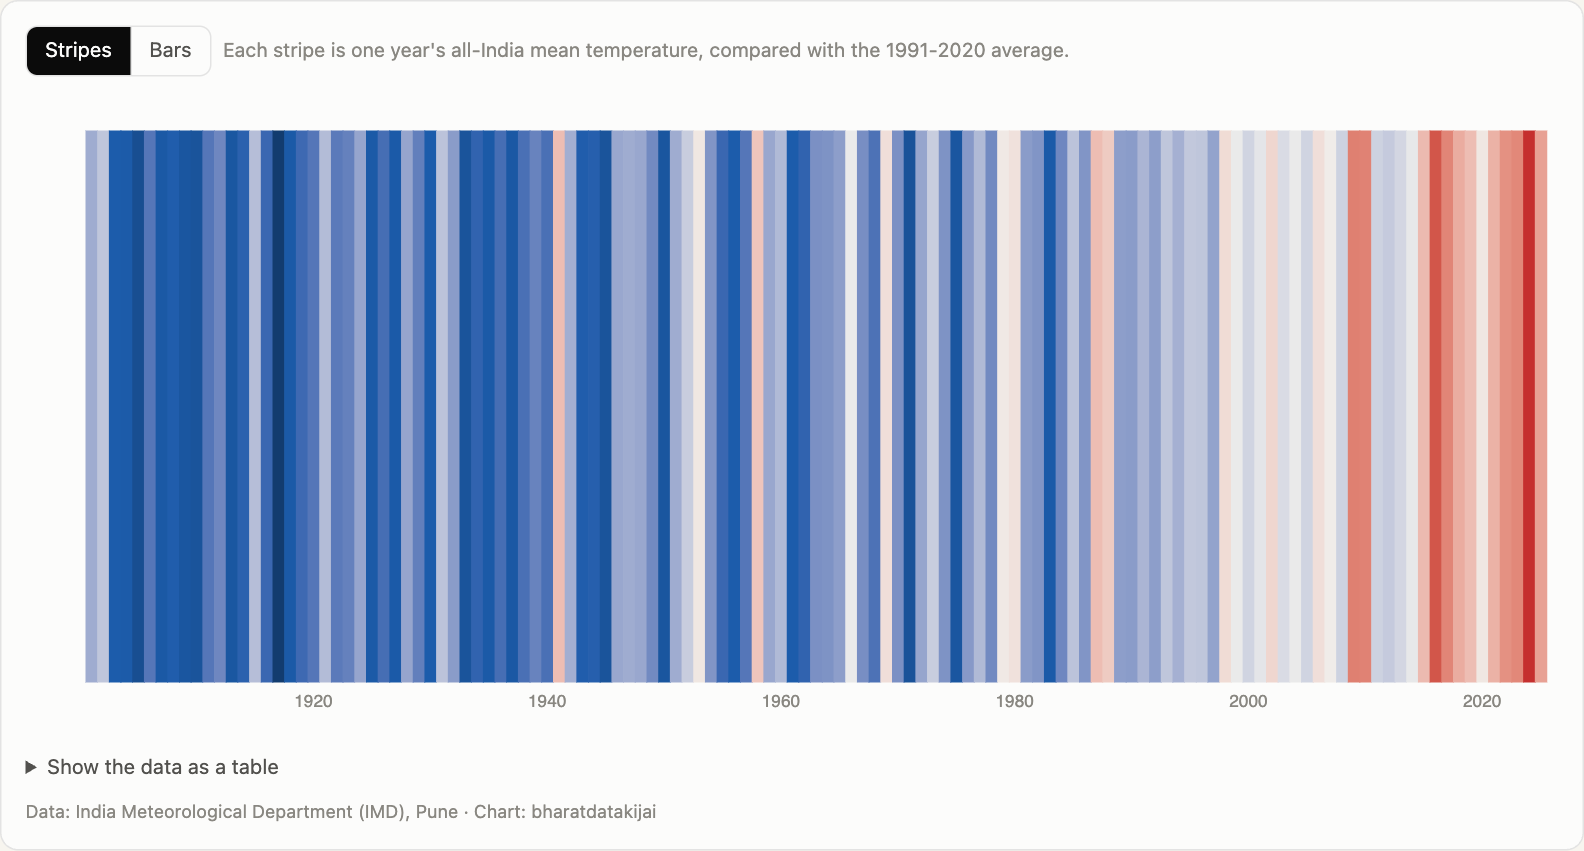
Each stripe is one year. Blue years were cooler than the 1991–2020 average, and red years were warmer. The data is IMD’s all-India annual mean land surface air temperature.
The coldest year in the record is 1917 (−1.29 °C). The warmest is 2024 at +0.65 °C, followed by 2016 (+0.54 °C). The stripes need no axis: the right-hand side of the chart is red.
Switch to Bars to see the size of each year’s anomaly. Hover over any stripe for its exact value.