Where India's food inflation comes from
In December 2019 vegetables cost 60.5% more than a year earlier. In October 2025 they cost 27.6% less, and headline inflation fell to 0.25%.
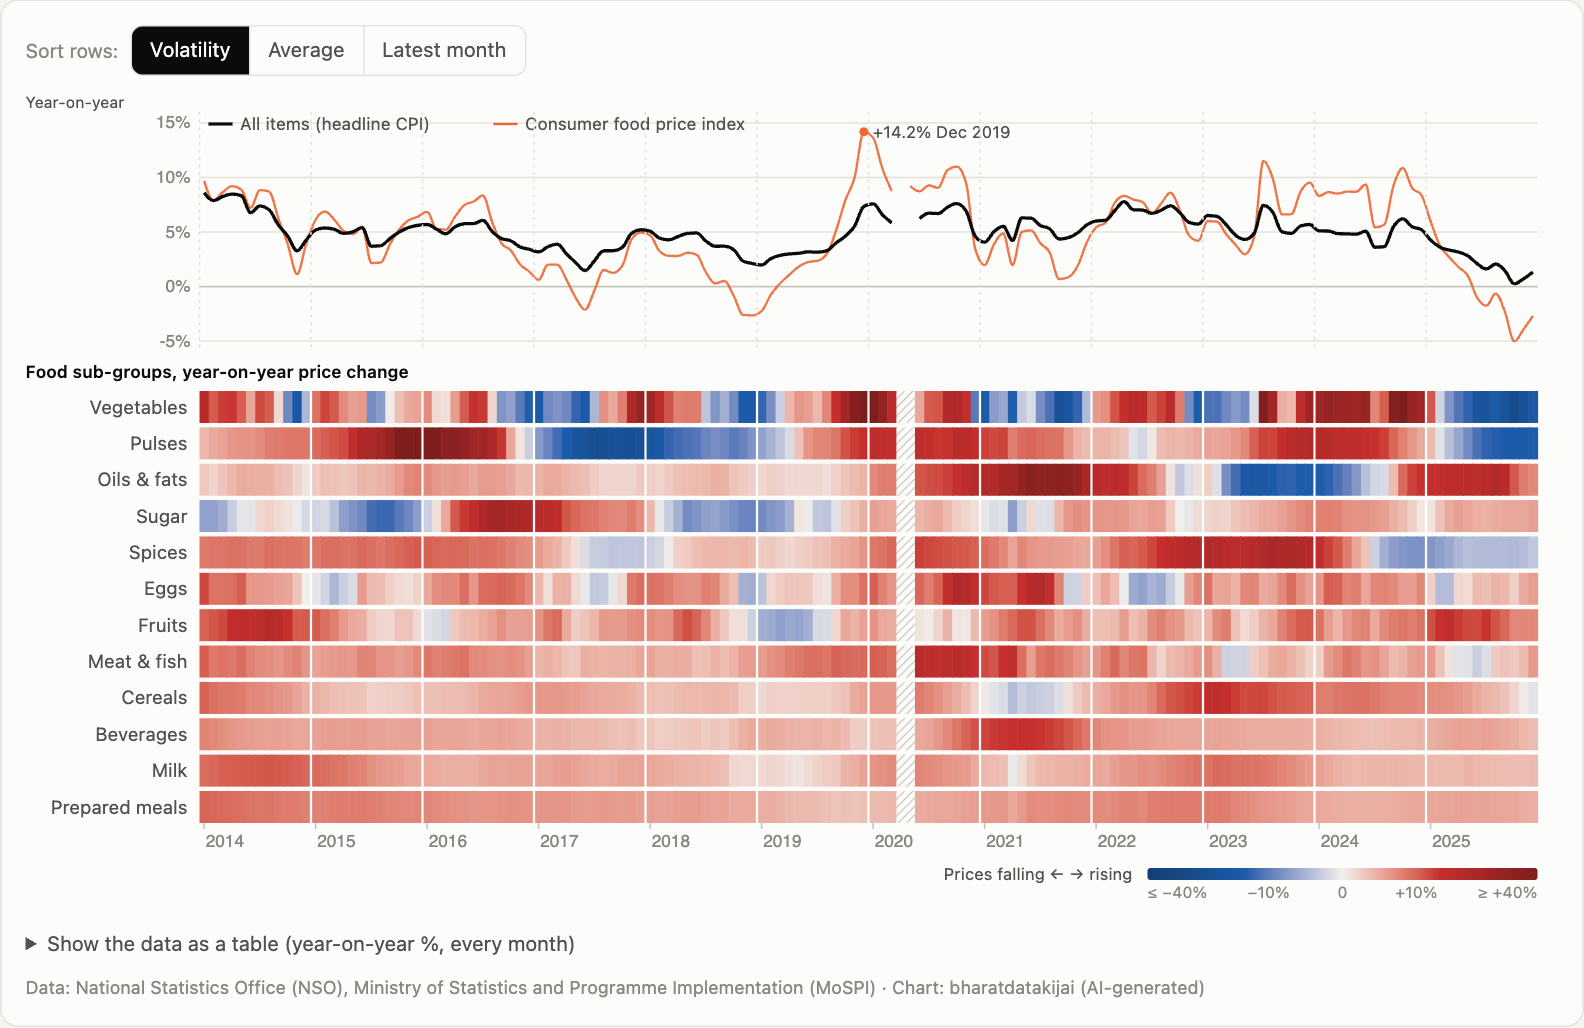
Each row is one food sub-group in India’s Consumer Price Index, and each column is a month. Red means prices were higher than in the same month a year earlier; blue means they were lower. The lines on top show headline inflation (all items) and MoSPI’s consumer food price index.
Most of the drama comes from two rows. Vegetables peaked at +60.5% in December 2019, the month the food price index hit its high of +14.2%. Pulses went from +46.1% in November 2015 to −24.7% in July 2017. Oils & fats had their own spike, +34.8% in June 2021. Meanwhile milk stayed between −0.1% and +11.3% for twelve years.
The right edge of the chart, 2025, is the coolest stretch in the series. The food price index was negative every month from June to December 2025, and in October 2025 vegetables were 27.6% cheaper than a year earlier. Headline inflation that month was 0.25%, the lowest month in the series.
Hover or drag across the chart to see every sub-group for a month, ranked. Use the sort buttons to reorder the rows.